Microsoft Power BI is similar to Excel, but the analytics are more powerful. Businesses use Power BI to make decisions based on real-time data. If you understand how Excel works, you can quickly learn how to use Power BI. Here is a look at this technology-driven tool.
Introduction to Microsoft Power BI
 Power BI is a business intelligence platform that turns raw data into visually appealing graphics. Businesses can process data, analyze, and dig deeper into analytics to discover actionable findings. To get a better understanding of this software, here is some basic terminology:
App
An app is a collection of reports, datasets or dashboards. App also refers to a mobile application, such as the Power BI mobile app.
Dashboard
You can only create dashboards with the Power BI service, not the desktop version. The one-page dashboard is also called a canvas and provides multiple graphs to tell a story of what you are measuring.
Model or Dataset
These terms are used interchangeably, although they have slightly different meanings. A dataset is data used to create a report. A model is data that has a relationship between tables in multiple data sources. Once you make a relationship, the information is ready to use in Microsoft Power BI.
Report
A report shows multiple visualizations of a single dataset. You can see different insights on one page or multiple pages.
Workspace
A workspace is a place to collaborate with team members to create reports and dashboards. There is also a workspace called My Workspace, which is your personal space. You cannot collaborate in that workspace.
Microsoft Power BI Product Portfolio
Power BI has several products in its portfolio. Each product plays a role in transferring data into usable formats to make intelligent business decisions.
Power BI Desktop
Use this free software to author reports. You can download it onto your computer and transform data into visualizations following these steps:
- Getting data: Decide which data you will use and then easily connect and clean up your data.
- Analyzing: Analyze the data to build models.
- Visualizing: Once you have analyzed the data, you can create interactive reports and graphs.
- Publishing: When you are satisfied with your reports, you can publish and share them with others.
- Collaborating: You can share your dashboard with others to enable them to dig deeper into the reports that are helpful to them.
Power BI Service
This is a cloud-based SaaS service where you can share the reports created with Microsoft Power BI Desktop. Mobile and cloud users can interact with the reports and edit them if they have the proper permissions.
Power BI Gateway
The gateway connects to the data sources. The connection enables the data to refresh continuously.
Power BI Report Server
Some companies need to keep their data and reports onsite. Power BI Report Server is a web portal where a company can display its KPIs and reports.
Power BI Mobile Applications
Download Power BI mobile apps for your smartphone or tablet to view real-time reports. You can create and share reports and set up notifications.
Components in Microsoft Power BI
Several components of Power BI enable users to create and share insights with people. You can also use these components within Excel to generate the analytics directly in the spreadsheet.
Power Pivot
Create data models with Power Pivot. You can establish relationships and create calculations.
Power Query
Combine and transform data from multiple sources. You can use this in Microsoft Power BI or as an Excel add-on.
Power Map
This 3D visualization tool enables you to plot more than a million rows of data using Bing. If you have longitude and latitude fields in your data, fill in those fields to provide better visualization.
Power View
Connect data sources and filter for each report. You can create interactive charts and graphs.
Power Q&A
After you create a data model and put it into Power BI, you can ask questions in natural language. You can get business questions answered quickly by asking in your own words.
Microsoft Power BI Features
Power BI is very popular with businesses. In addition to integrating with several Microsoft Office 365 products, including Project, here are other reasons why it's a tool of choice.
Near-Time Data Refresh
Reports and graphs refresh when an updated dataset is available. Dashboards also update in real time.
Azure Integration
Integration with Azure helps examine patterns and insights in datasets. Using Power BI with Azure enables you to use and share enormous amounts of data. Use Azure Data Systems to create apps with built-in artificial intelligence capabilities.
Customization
Easily customize Microsoft Power BI to work for your business. Use the custom visualization library to change dashboards. Personalize the interface and customize security features and navigation.
Interactive User Interface
The reports in Power BI are visually appealing. However, if you want to change how they look, you can easily drag and drop to copy formatting across visualizations. The interface is easy to use and understand and is based on Microsoft Office 365.
Massive Amounts of Data From Multiple Sources
With Power BI, you can pull in multiple sources of data. An Azure data lake enables you to process massive amounts of data faster.
Excel Integration
If you are familiar with Office 365, you can easily connect Excel reports and data models to Power BI. You can also share Excel data through Power BI.

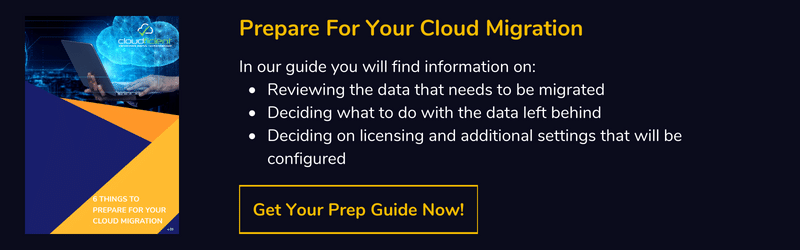
Migrate to the Cloud To Use Microsoft Power BI
Portions of the Microsoft Power BI platform are on the cloud. If you have not migrated your business to the cloud yet, contact Cloudficient to help.
With unmatched next generation migration technology, Cloudficient is revolutionizing the way businesses retire legacy systems and transform their organization into the cloud. Our business constantly remains focused on client needs and creating product offerings that match them. We provide affordable services that are scalable, fast and seamless.
If you would like to learn more about how to bring Cloudficiency to your migration project, visit our website, or contact us.
.png?width=620&height=82&name=Untitled%20design%20(18).png "Cloudficient")
.png?width=600&height=79&name=Untitled%20design%20(18).png "cloudficient logo")